
Somewhere in America, a company is trying to build the future. The land is available, the customers are waiting, the financing can be arranged, and the servers can be ordered. The missing item is more basic than any of them: the power to turn the machines on. A transmission upgrade may take years, a turbine may have to be reserved before it is manufactured, and a transformer may be unavailable because another buyer reached the factory first.
AI arrived quickly, and its appetite for computation is unlike the load growth the American power system had been planning for. The present infrastructure challenge combines a rapid increase in demand with an economy carrying a large stock of public obligations. The question is how a financial system shaped by those obligations allocates the capital and physical resources required for the next buildout.
Federal borrowing and AI-era scarcity operate through different mechanisms. Public borrowing can affect the price and allocation of private capital, while AI demand can reallocate physical resources when supply cannot expand fast enough. The two mechanisms operate on different clocks and can affect the same investment decisions. Federal borrowing is one factor among several that shape the productive capacity available when the demand arrives.
The first crowding-out mechanism works through finance
Federal debt held by the public fell to about 34 percent of GDP in 2000 after the late-1990s budget surpluses. By 2026, CBO's February baseline placed the ratio at 101 percent of GDP, rising to 120 percent by 2036 under current law. CBO's October Monthly Budget Review gives a preliminary FY2026 estimate of a $2.0 trillion deficit and $1.143 trillion in net interest outlays, up 11 percent from 2025. Interest paid to domestic holders remains income within the economy; the portion paid to foreign holders, roughly 30 percent of publicly held debt, is a transfer abroad. Some borrowing financed research, stabilization, infrastructure, and other activities with real value. CBO's formulation is precise: debt held by the public matters because the government borrows in financial markets alongside other participants, and that competition can push up rates and crowd out private investment.
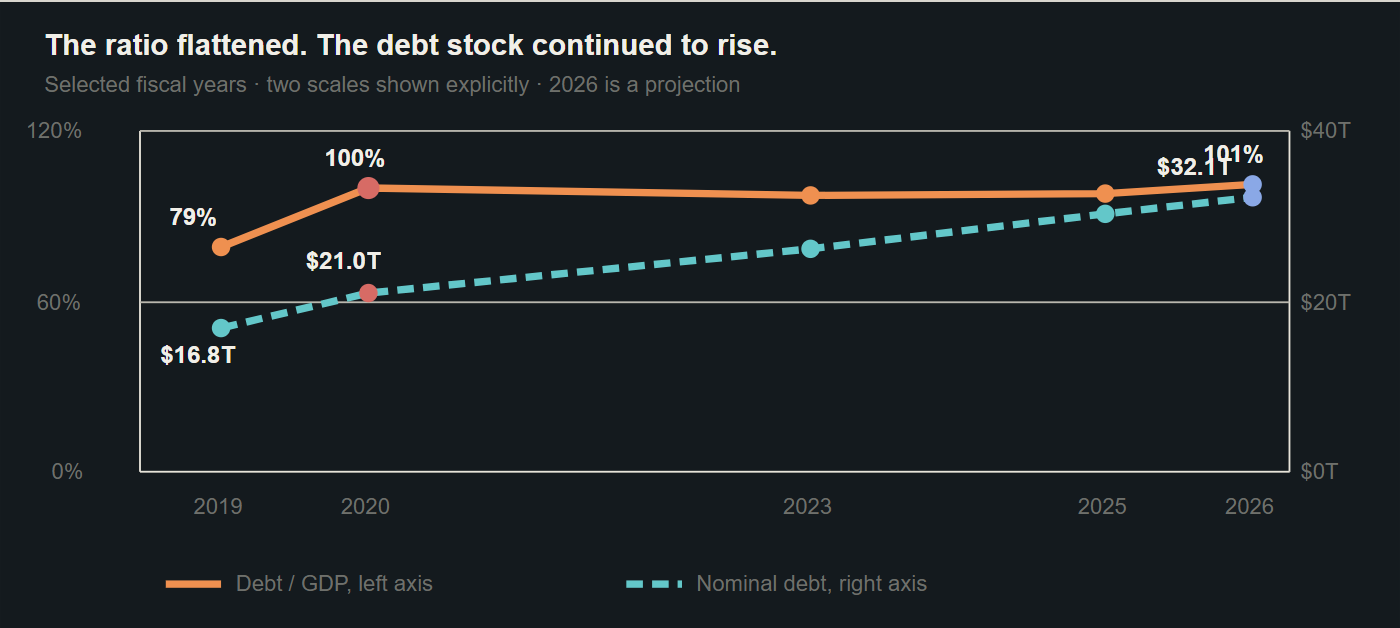
The Federal Reserve has now supplied an estimate of the mechanism. A 2026 FEDS paper using a natural experiment found that a one-percentage-point increase in expected U.S. debt relative to GDP raises the long-run neutral interest rate by about one to two basis points and the ten-year Treasury term premium by about two to three basis points. Applied mechanically to the roughly 66-point rise from 2000 to 2026, that implies approximately 66 to 132 basis points on the neutral rate and 132 to 198 basis points on the term premium. That arithmetic extends the paper's marginal estimate beyond the range of its experiment, so it is a sensitivity, not a historical measurement. It does show the scale of the financing channel: on a 30-year asset, moving a 7 percent capital cost to 8 percent raises the annualized capital recovery factor by roughly 10 percent. Federal Reserve research establishes the channel; it does not measure the infrastructure that a different debt path would have produced.
U.S. electricity demand was nearly flat from the mid-2000s into the early 2020s, according to the Energy Information Administration. Utilities had limited commercial reason to build surplus capacity, and permitting, market design, retirements, and uncertain load forecasts influenced development alongside financing. The channel was weakest when debt rose fastest, because the economy had slack and rates were low. But the claim is counterfactual: without the additional debt, rates would have been lower still. Lower federal borrowing would not by itself have produced projects without sufficient expected demand or approvals.
The second crowding-out mechanism works through scarcity
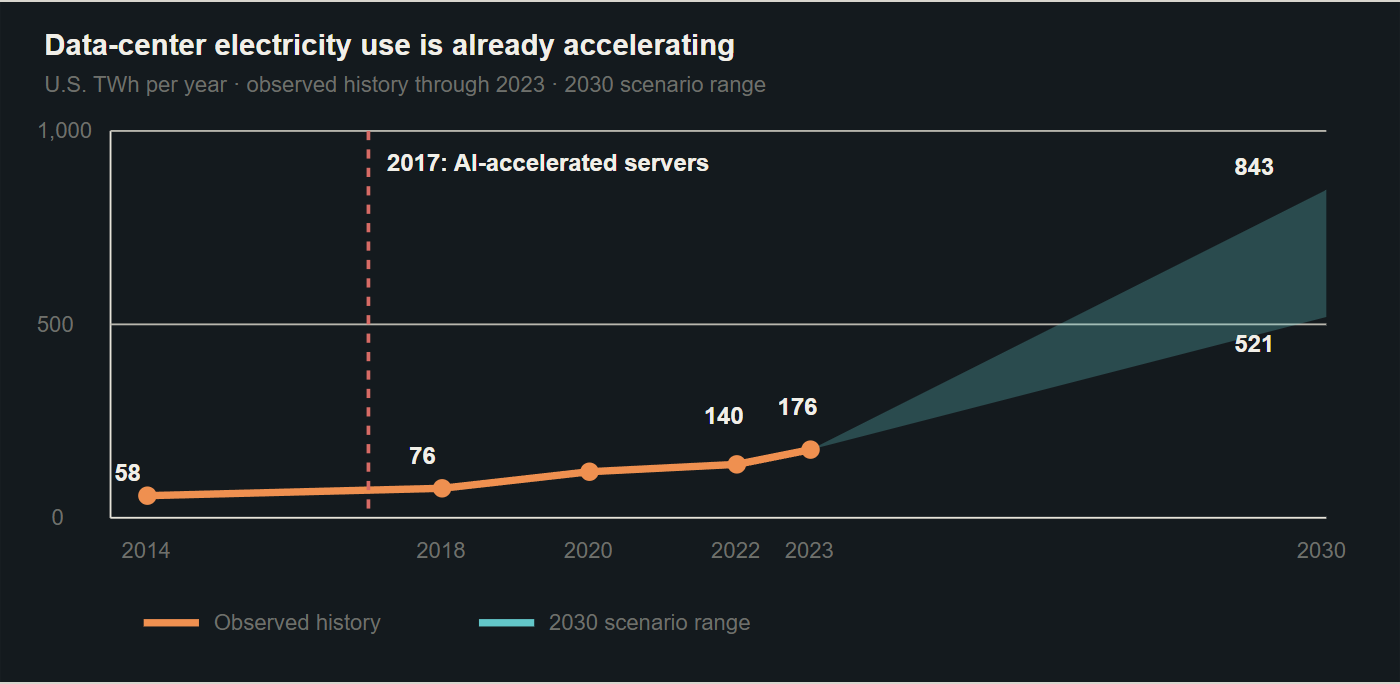
Artificial intelligence changes the problem because its demand is not merely large. It is concentrated, urgent, and willing to pay for the highest-value bottlenecks. In the 2025 update to its U.S. data-center energy report, Lawrence Berkeley National Laboratory estimates that data centers could consume 11.8 percent of U.S. electricity in 2030 in its reference case, with a sensitivity range of 9.5 to 15.3 percent. Those are modeled scenarios. They describe a system in which the time required to add supply matters as much as the eventual quantity of supply.
Dylan Patel, CEO of SemiAnalysis, made the underlying economics plain in his conversations with Dwarkesh Patel on Dwarkesh's podcast. In the March 2026 discussion of compute bottlenecks, he said that AI's capacity constraints mean model providers “have to destroy demand,” and explained that freeing memory for AI may require consumer demand for laptops and phones to fall as prices rise. In the later conversation, he and Dwarkesh discussed a modeled $11 trillion of hyperscaler and cloud capital expenditure through 2029, with more than $5 trillion requiring credit. The $11 trillion is a SemiAnalysis modeling scenario discussed by Patel, not a public-sector forecast. His rate estimate was explicitly “vibing a number,” while the underlying allocation mechanism is the relevant point: when a scarce input can earn an extraordinary return in AI, it is allocated toward AI by price, contract, and financing priority.
Electricity makes the distinction visible. A data center that signs for scarce capacity does not necessarily create an equivalent amount of new capacity for the country; it may secure a substation ahead of a manufacturer or absorb a utility's near-term generation margin. Berkeley Lab's interconnection research found roughly 1,400 gigawatts of generation and 890 gigawatts of storage in active queues at the end of 2024, while only 13 percent of capacity that entered queues from 2000 through 2019 had reached commercial operation by the end of 2024. A queue is an intention, not a power plant.
From 2005 to 2025, the United States added nearly 47 million people while reducing conventional fossil and nuclear generating capacity by approximately 47 GW, according to the 4DR capacity history and the EIA generator inventory. Most of that capacity change reflects cheap natural gas, environmental rules, aging plants, and flat demand, not a demonstrated federal-debt effect. Its significance here is physical: the country entered the AI buildout with a thinner margin of conventional dispatchable capacity than the population and industrial base might otherwise have carried. The debt channel matters now in a different way: rebuilding that margin requires exactly the long-lived, capital-intensive projects most sensitive to financing costs. High-return AI uses then receive priority through prices, contracts, and financing, while other users adjust their consumption or investment. The resulting difference between gross AI investment and net additional national capacity is an inference from the mechanisms, not a separately measured statistic.
AI could generate productivity gains large enough to exceed the displaced activity, and public research helped create some of the technologies that made the present wave possible. The relevant measure is not whether AI spending or government debt is large, but whether the additional output created by each allocation exceeds what it displaces. Gross capital expenditure is observable. Net national productivity is the harder account.
What the ledger cannot show
The deeper problem is temporal. Capital can be repriced in an afternoon. A power plant takes years. A transmission corridor takes longer. A semiconductor supply chain is built from factories whose own suppliers must expand before the first new chip exists. The most expensive consequence of America's borrowing history may not be the interest it pays today, but the time it lost before the future made capacity valuable.
The future arrives as a demand for capacity. America can meet it through new construction, or through the reallocation of existing capital, equipment, and electricity. The distinction will determine how much of AI's apparent expansion becomes additional national capability.
Sources
- CBO, Monthly Budget Review: September 2026 ↗
- CBO, The Budget and Economic Outlook: 2026 to 2036 ↗
- CBO, Chapter 1: The Outlook for Deficits and Debt ↗
- Federal Reserve, The Causal Effect of Debt on Interest Rates ↗
- EIA, U.S. electricity consumption ↗
- EIA, Generator Inventory ↗
- Berkeley Lab, Data Center Energy Usage Report: 2025 Update ↗
- Berkeley Lab, Queued Up: 2025 Edition ↗
- DOE, Grid transformer lead times ↗
- Treasury, FY2020 debt report ↗
- 4DR, The Grid We Chose ↗
- Dwarkesh Patel, Dylan Patel compute-bottleneck transcript ↗
- Dwarkesh Patel, Dylan Patel capital and compute transcript ↗